04
Technical performance: where quality still varies
Technical performance is broadly addressed. The next Pulse points come from the other three drivers.
Technical Performance measures whether a product feels smooth, responsive, and stable. Across the market, almost every app clears the threshold. But products where tech is the strongest driver still sit close to the Pulse average. Engineering alone does not create leadership. This chapter examines where technical quality is now expected, where it still breaks, and where it remains a competitive advantage.
6 minutes
Scroll down

Technical performance is broadly addressed. 93 percent of apps clear 3.5
“Smooth and responsive” averages 3.8 across the market. “No crashes” averages 3.8. These are the highest-scoring statements in the whole study. 93 percent of apps clear a 3.5 on technical performance.
The market has converged on technical competence as a prerequisite for being taken seriously. When 93 percent clear the bar, users stop noticing when tech works. They only notice when it breaks.
For the 7 percent below the threshold, the reading is different. The next three statements show where they cluster and why.
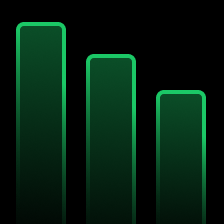
Distribution of technical performance scores
93% of apps score above 3.5
Provided by framna
Smooth & responsive: 3.77. No crashes: 3.76. Highest-scoring pair of statements in the study. Average of two statements per app: 'smooth and responsive' and 'no crashes'. Distribution across 613 app-market observations with complete driver data (399 products).
Provided by framna
If every competitor scores above 3.5 on tech, what is your differentiator?
The market looks stable. The category battles are not
At the market level, tech is addressed. 93 percent of apps clear 3.5.
Below 3.5, the tail concentrates.
16%
of apps in Car, Productivity, and Lifestyle sit below the threshold.
2%
of Finance apps fall below the threshold.
If your category sits at the median or above, the next Pulse point comes from UX, Trust, or Feature richness. If your category sits in the tail, technical performance is the active fight.
The 93 percent who clear the bar got there through engineering discipline that took years to learn. AI tools now help teams ship faster, but speed without that discipline produces apps that look fine in testing and fail in the user’s hand. Whether tech stays at 93 percent depends on whether the next wave of products keeps the discipline that got it there.
Technical performance by category
Median tech score (1–5). Finance leads. Car and Productivity & Lifestyle carry the longest tail of apps below 3.5.
Provided by framna
The wider the spread between median and bottom in a category, the more the problem lives in specific sub-categories rather than the category as a whole. Median technical-performance score per category, plus the share of apps in that category scoring below 3.5. Significant (app, country) pairs only.
Provided by framna
Where does your category sit on tech, and what is your next Pulse point if not tech?
When the app is the only interface, tech carries everything
The shared structure
These three sub-categories share a structure. The app is the only interface to the underlying service. If the app does not work, the product does not work.
Why tech matters more here
Technical performance is the foundation of the value proposition, so a drop on tech pulls everything else down with it.
Why the scores stay low
External constraints (hardware dependencies, fragmented operator markets, licensed content) make the work harder, not impossible. What holds these scores down is internal: the app is a thin layer on top of operations the team does not own, and ownership of the user experience is fragmented.
What changes the outcome
The app team needs to sit close to the core business, not at the edge of it. The fix is rarely software-only; more authority over the operational layer, more roadmap protection, or both.
At the market level, technical competence is expected. In these sub-categories, it is still unresolved.
Count how many teams must coordinate to resolve one recurring user issue. If the answer is more than two, the fix is organizational before it is technical.
Where tech sits below 3.5
App-market pairs below 3.5 on tech. Top 8 of 20 sub-categories; Smart Home, Parking, and Streaming carry the heaviest concentration.
Provided by framna
Hardware-bound apps, physical-world infrastructure, and licensed-content streaming dominate the bottom of the distribution. (App, country) pairs with technical performance below 3.5, grouped by sub-category. 39 pairs fall below the threshold, of 563 significant pairs. The chart shows the top 8 of 20 sub-categories by concentration.
Provided by framna
If your product sits in the tail, treat technical ownership as the product problem.
Technical performance is necessary. Leading with it is not enough
The step from good to great on technical performance adds 0.2 Pulse points. BankID, Picnic in the Netherlands, and Storytel sit at the top of this range. At this level, users report no crashes, no lag, no errors. The investment pays.
But leading with technical performance does not put a product ahead of the market. More than half of apps score highest on tech, and they still average Pulse 3.87, the market average. The other three drivers are what separate the leaders.
AI coding tools help every team ship faster. But it does not change what users value. The investment that still compounds sits in Trust, Personalization, and completing the job users came for.
Pulse lift per technical-performance quartile
Provided by framna
Per-app tech score sorted into quartiles. Mean Pulse per quartile, then the step size between adjacent quartiles. 53 percent of apps score highest on technical performance; 28 percent lead the next driver by 0.1 points or more.
Provided by framna
Is another driver now a better use of the next product investment?
What this means
Finding
Technical performance is broadly addressed. The next Pulse points come from the other three drivers.
Evidence
93 percent of apps clear Pulse 3.5 on technical dimensions. The step from the third to the fourth quartile on tech adds 0.2 Pulse points.
Implication
Technical excellence stays essential. The next Pulse points come from Feature richness, Trust, and design.
What we did not expect
We expected the 7 percent failing on tech to cluster in hardware-bound categories. They do. The user pressure in those moments is at its peak: you need the parking app to work now, the lights to respond, the robot vacuum to finish the kitchen. A failure there lands harder than other failures. What looks like a tech failure is an operating-model failure dressed as one. The fix is who decides what across teams, not what the engineering team ships next. Solvable, but rarely inside a single sprint.