02

What strong apps get right

Strong apps score high across all four drivers, but categories reward different strengths.

Strong apps do not specialize. The leaders in this study score high on all four drivers. Reading the top quartile is not a search for a signature strength. It is a search for what the rest are leaving on the table.

The framework applies to every product. The driver that matters most varies by category and by product, but the pattern of strong apps is the same in every category: height across all four, plus the one thing they finish for the user.

8 minutes

Scroll down

Strong products deliver on every driver

Group the apps by App Pulse Score into three tiers, from highest to lowest. The top tier is higher than the rest on every driver, not on one. No single driver carries the difference.

A product team cannot win by doubling down on its strongest driver. The Pulse lift comes from raising the lowest score.

Reading your own profile, look at your lowest of the four driver scores. That is where the next round of investment will move the App Pulse Score the most. If your product is not in the study, the same four-driver test applies. Score your product on each driver, find the lowest, and start there. Search any of the nearly 400 products in the study to compare.

*A note on the sample. The nearly 400 apps in this study were chosen because they already matter in their categories. They start from a higher baseline than the full mobile landscape, where 85 percent of apps carry a negative NPS (the Introduction). “Lowest” here means the lower end of an already strong segment.
What separates the tiers is height across all four drivers
Average driver scores for top, middle, and bottom of the market, ranked by App Pulse.

The top quartile is 0.3 to 0.4 points higher than the lower quartile on every driver. No driver pulls ahead of the others inside any tier.

Apps ranked into quartiles by App Pulse across 399 products significant in at least one market. Bars show the average of each of the four drivers within the tier.

Provided by framna

Provided by framna

Leaders complete the job users came for

Feature completeness means one thing. The product has what users need to finish the job they came for. An app that finishes one job scores higher than an app that starts ten.

“Has all needed features” is the single survey statement that tracks App Pulse most closely. Users answer it against the job they came for, not against the category as a whole.

Competitor analysis shows the category baseline: which features are table stakes, what users expect on first use. It does not tell you which job your users want finished. That answer comes from your users, not your competitors.
Two paths lead to completeness. Sydbank in Denmark and Rabobank in the Netherlands score above 4.1 because they cover the features users expect from a full-service bank. Swish, the Swedish person-to-person payments app, scores above 4.1 because it covers its one job. Both paths work. The trap is the middle: ten jobs started, none finished. Solving a customer’s problem well creates indispensability.

The test for your own product is one question. Is the job your users came for finished inside the app, or do they have to leave to complete it?
Which driver statements track App Pulse most closely
Eleven driver statements, ranked by how closely each tracks App Pulse.

‘Has all needed features’ tracks App Pulse more closely than any other driver statement.

How tightly each of the eleven driver statements tracks the overall App Pulse Score, ranked. Apps named are among the highest-scoring on the completeness statement.

Provided by framna

Provided by framna

Every category rewards a different strength

Feature richness moves Pulse most at the market level, followed by Technical Performance, Trust, and UX and Design. It is also the lowest-scoring driver in eight of nine categories. The biggest open ground.
Inside a category the picture changes

Education & Entertainment

Technical performance leads. The product has to play without lag, sync across devices, and remember where users stopped.

Finance & Insurance

UX and Trust both lead. Users need clear flows and confidence the product is acting in their

News & Social Media

Feature richness and Trust carry it. Users come back for relevance and credibility. Polish does nothing.

Car

Feature richness, Trust, and UX all matter here. The product becomes part of the driving habit when all three are strong. Fixing stability alone does not move Pulse, even in Parking apps where tech often fails.

Find your category in the heat map below and read its strongest driver. That is what your users measure your product against. Then use the search at the top of the page to find your specific product, and compare its driver profile to your category’s pattern.

Per-category Ridge regression with country fixed effects and Overall Quality halo control. Mirrors the dashboard's Category Driver Profiles methodology applied to 625 app-country observations across nine categories. Standardized betas show each driver's unique contribution to App Pulse beyond overall app quality. Full detail in the methodology section on the about page.

Which drivers move App Pulse most, by category
Per-category strength of each driver. Higher value = stronger driver in that category.

Negative values (e.g. UX in News & Social Media) mean more investment in that driver does not lift Pulse for that category.

Provided by framna

Provided by framna

Two products at the same App Pulse Score can have opposite driver profiles

Digital Post and Headspace sit close on App Pulse — Digital Post 4.0, Headspace 4.2 — yet their driver profiles are mirror images. Pulse measures the level. The driver profile shows what kind of product sits at that level.

Digital_Post_App3

Digital Post

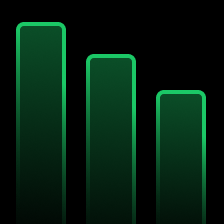
Digital Post in Denmark scores App Pulse 4.0. Its Trust score is 4.1; the other three drivers sit at or below 3.7. The product is trusted but flat on experience.

Headspace_App

Headspace

Headspace scores App Pulse 4.2, just above, with the inverse profile. Technical Performance and UX and Design both clear 4.0, Feature richness sits at 3.8, and Trust drops to 3.6. The product is experience-led and lighter on trust.

App Pulse places a product in the market. The driver profile explains what kind of product it is. Compare your own product to a leader by reading both: two apps in the same Pulse tier can need opposite next moves.

The pattern does not change as product creation accelerates. Strong apps still score high on all four drivers and finish the user’s job cleanly. What changes is where teams spend time. Faster execution raises the value of discovery, judgment, and product direction.

App Pulse pools satisfaction, NPS scaled to 1–5, and the four validated drivers into one score. Driver scores come from eleven survey statements, pooled across markets where the product is significant. ‘Driver profile’ means the underlying combination of the four driver scores: which one a product is high on, which one it is low on.
Same App Pulse, opposite driver profiles
Digital Post and Headspace land near the same App Pulse with inverse driver profiles.

The App Pulse Score places both products at roughly the same quality level. The driver decomposition explains what kind of product each one is.

Provided by framna

Provided by framna

What this means


Finding
Strong apps score high on all four drivers and finish the job users came for. The framework applies to every product; the driver that matters most varies by category.


Evidence
The top quartile leads the lowest by 0.3 to 0.4 points on every driver. “Has all needed features” is the single statement most tightly tracked with App Pulse. Per-category Ridge regression shows different drivers move Pulse in different categories.


Implication
Read your own driver profile, find the lowest, and start there. There is no single recipe; the driver that matters most depends on your category.

What we did not expect
We had a hypothesis when revising this year’s model: top apps are strong on every driver we measure. It held. We reverse-engineered the four drivers from what moves App Pulse, and every one correlates. The leaders score high on all four. No signature strength means no signature weakness either, and a deep moat on one axis is not what the top of the market looks like.

03

Where to play: the 2026 market map

Scroll to load